

The new Chancellor’s misdiagnosis
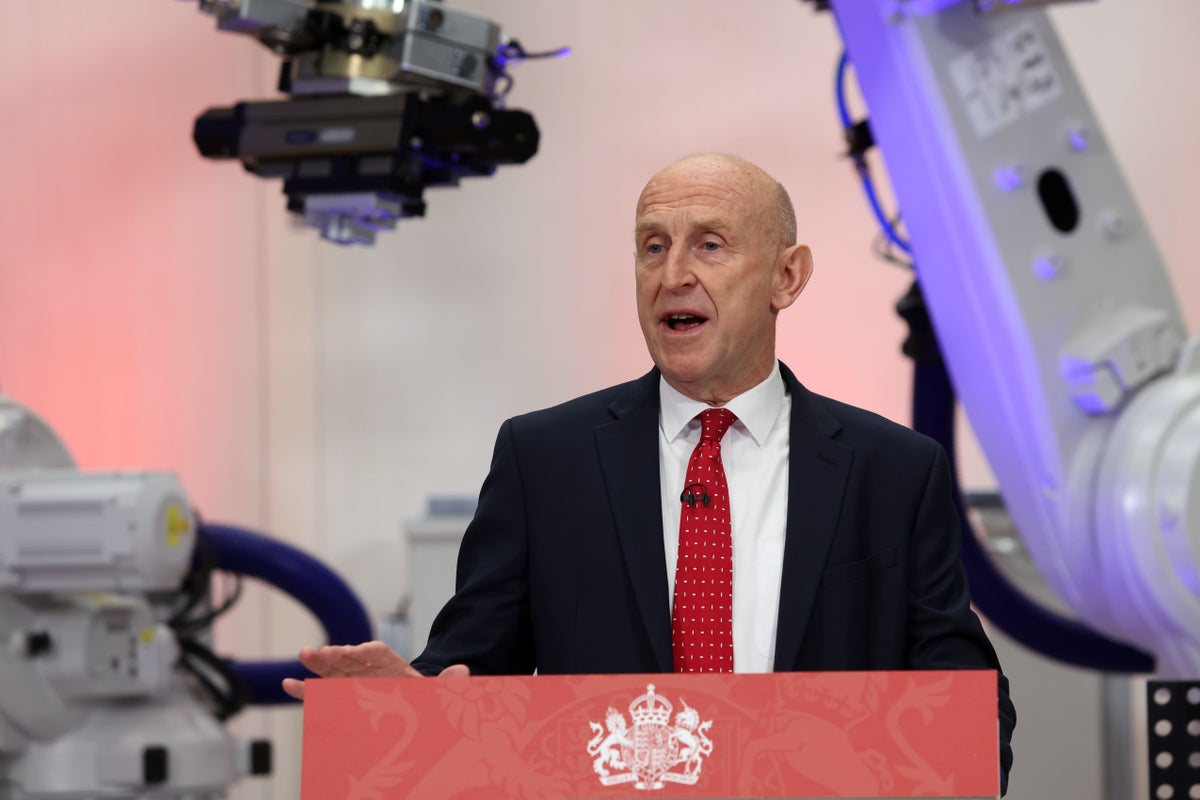
John Healey's first major speech as Chancellor, delivered in a Coventry factory weeks before his budget, was a torrent of platitudes rather than an accurate diagnosis of what ails the economy.
First published in Noise Cancelling

Let thy speech be better than silence, or be silent.
The new Chancellor of the Exchequer, John Healey, gave a speech about the economy on Monday in a factory in Coventry, which has naturally attracted a lot of attention, not least because we are only weeks away from his first budget.
Apparently, this was his first major speech since taking the job in July, and the media were out in force that afternoon analysing the text and opining on what it might imply for the decisions he will make in the budget.
A speech I feared
Unlike Rachel Reeves, who naively went out of her way to test opinions ahead of her two budgets by leaking all sorts of potential initiatives which went on to shatter business and consumer confidence over the months leading up to the event, thankfully Mr Healey hasn’t made the same mistake.
Unfortunately, that’s where the good news ends, I’m afraid, because once again this turned out to be as bad a speech as I feared it might be. Instead of an accurate diagnosis of the challenges confronting the economy and the steps the government might take to do what it can to address those issues, (in reality there isn’t much it can do to help but as his predecessor showed, there are plenty of things it can do to hurt the economy) what we got from Mr Healey was a torrent of platitudinous horse manure.
Close to the top of my list were “my defining mission as chancellor is growth” (that one in the questions afterwards) closely followed by I want Britain to be “a country of wealth creation”, and fiscal discipline remains the “first priority” but perhaps best of all were, the government has a “moral” and “fiscal” duty to address the “scar” of youth unemployment and the gold medal winner, the attribution of currently high gilt yields to Liz Truss, whose 49-day administration ended four years ago. I seem to recall that Rachel Reeves used exactly the same script during her tenure but instead of delivering on these noble aims, she did the exact opposite.

Her first two budgets resulted in massive increases in government spending, almost £70bn a year from her first budget alone, with more added in the second, huge increases in tax, more regulation especially of the labour market, more borrowing and measures that led directly to higher inflation.
How any of that is consistent with the aims she espoused and which have been repeated by her successor is totally beyond me. I sometimes wonder if politicians think that we are all suffering from amnesia, or worse that we have no memory at all or even that we are all just very thick. Either way it’s pretty insulting and I would have preferred Mr Healey to keep his vacuous nonsense to himself.
The misdiagnosis
I suppose my chief concern with the new Chancellor is that he appears to lack any proper understanding of what ails the UK economy and instead of conducting an appropriate analysis of its disease, like some quack doctor, has proposed a vague series of measures that would, even if implemented, completely fail to address the underlying problem.
Let’s start with the misdiagnosis.
- High borrowing costs are, according to Mr Healey the result of “high borrowing, low growth”.
- The yield premium in UK gilts is some kind of mysterious four-year-old legacy of Liz Truss’s 49-day administration.
- More devolution, more public leadership and control (whatever that means), and “more investment, more innovation and more jobs”.
I’ll deal with each piece of nonsense in order.
Borrowing does not set yields
I wrote about this myth a few weeks ago in “Deficits, gilts and the cost of living: more myth busting”.

Contrary to the almost universally held doctrine, there is no causal relationship between the scale of government borrowing and bond yields in either the US or the UK. In fact, over the long term, higher deficits are very loosely correlated with lower bond yields.
On the other hand, there is a very strong causal relationship between official rates (fed funds and base rates) and bond yields, with the former explaining 81% of the variability in the latter in the US, and of course, official rates in both the US and the UK are driven by inflation. That’s Mr Healey’s first error.
What Liz Truss actually did
The second is his attribution of all or some of the current yield premium in gilt yields to Liz Truss’s “mini-budget” which in fact was not a budget but a growth plan. It announced a series of pro-growth measures including significant tax cuts, but it was not accompanied by commensurate and deliverable spending cuts. At the time the country was confronting an inflation crisis (CPI was 10.1% in September 2022) as were many European economies, following Russia’s invasion of Ukraine in February of that year.
Quite what led to the hissy fit in the gilt market at the time is impossible to prove but to attribute what’s happening now to those one-off events four years ago is one of the most ridiculous things I’ve heard in a very long time.

The claim that there is still a ‘Truss penalty’ in the cost of UK government borrowing is both lazy and silly … that was four years ago. I have yet to meet a single bond trader who still blames Liz Truss for the current problems.
Whilst we are on the subject, as you may know, I quite enjoy slaying popular myths and here’s one that really does need slaying. The established view is that Liz Truss “crashed the economy”. Given that the media and countless politicians have been repeating this accusation for four years, I can fully understand why it has now become “truth”. But, far from crashing the economy, I think in retrospect she may well have saved it. Let me explain why.
The gilt market did have a hissy fit in the immediate aftermath of the announcement of her growth plan – my God, we need one of those right now – and the initial move in yields did cause a big problem for highly levered funds investing in the gilt market. But in my view, the panicked selling was caused by excessive leverage in these funds, not by the plan itself, and as is always the case in financial markets, when you get a cocktail of a market move and high leverage you get a messy market.
Panicked selling was caused by the banks that had lent to these levered funds making margin calls, which forced them to sell more into an already weak market and, hey presto, a full-blown hissy fit. The Bank’s own case study of the episode describes the same mechanism. It’s also the case that the growth plan had bypassed the OBR, the much-revered establishment darling, and this clearly upset those in the unelected corridors of power, and the rest is history. Within three weeks, the chancellor had been fired, and Liz Truss followed him out within the month.
But what gets missed in all this camouflage is what Liz Truss did to save the economy at an extremely difficult time. As the chart shows below, following Russia’s invasion of Ukraine, gas prices in Europe spiked. The spike, as you can see in the chart below, makes the current blip in prices look tame, with prices in August 2022 reaching more than three times their current level.
2022 makes this year’s gas spike look tame
Without Liz Truss’s intervention in the form of an “energy support package” which capped energy price increases for households and businesses, the economy would have crashed. Here’s why. At the time, the Treasury put the cost of the energy package (the Energy Price Guarantee for households, the Energy Bill Relief Scheme for businesses and a financing scheme for energy suppliers) at around £60bn for its first six months; the OBR’s outturn for all energy support in 2022–23 was £51.1bn, or 2.0% of GDP. Of course this one-off cost was added to the national debt, but the speed and scale of the intervention saved the economy from a steep recession. Thanks Liz!
Gilts follow Treasuries
So, to return to misdiagnosis, if high borrowing isn’t pushing yields up, what is? Well, as I explained in last week’s Weekly, gilt yields have been and still are tied to US Treasury yields, as this chart shows below.

Gilts have followed Treasuries for forty years
In fact, over the last forty years, ten-year gilts have on average traded at a 42bps premium to their equivalent treasury yield. Today that premium was 39bps. So, on this basis the so-called premium yield in UK gilts is about 3bps lower than the average of the last forty years. That can be seen clearly in the chart below which is reproduced from a very recent Noise Cancelling research piece.
The gilt premium is below its forty-year average
Meanwhile ten-year treasury yields are slightly below where you would expect them to be based on over 43 years of history as you can see in this chart which shows the relationship between Fed funds and ten-year treasuries over 523 months going all the way back to 1983. In fact, this historical record shows that when rates are at 3.75% ten-year treasury yields have averaged 5%. The current ten-year yield of just below 4.8% is therefore slightly below where it has traditionally traded when official rates in the US are at 3.75%.
The long bond follows the short rate
Which in turn answers the question why US treasury yields are at 4.8%. It’s entirely because the Fed deems it appropriate, given the current elevated level of inflation in the US, to have Fed funds at 3.75%. It really is that simple.
So, in summary:
- Fed funds are at 3.75% because inflation in the US is elevated because of what’s happened to energy prices since the war started in February.
- Fed funds at 3.75% means ten-year treasury yields will be close to 5%: in fact they are just below at 4.8%.
- Given the long-run relationship between ten-year yields in the US and the UK, this means ten-year gilt yields will trade at about a 40bps premium to their equivalent treasury yield and that’s pretty much exactly where they are at 5.19% today.
- Finally, in the US over the last 40 years inflation has averaged 2.75% (it’s now at 3.4%) and ten-year bond yields have averaged 4.65%. There really is nothing exceptional about what’s going on right now. Nothing at all.
So, Mr Healey, before opining on fiscal credibility and the causes of elevated gilt yields in some clumsy attempt to burnish your financial market appeal, I would advise apprising yourself of the facts. It might help to know what’s really going on rather than just parroting the financial media’s histrionic drivel.
Devolution: twenty-five years of evidence
Finally, to the third misdiagnosis.
The third solution to the country’s ills, according to Mr Healey, is more devolution, more public leadership and control, more investment, more innovation, more jobs. The last two are outcomes rather than inputs, and so I think the message here is that Mr Healey thinks devolution and more investment are the answers to the UK’s growth challenge. (I am not at all sure what “a greater degree of public control and leadership” means, and so I will avoid commenting on this other than to say more public control is not something that has ever been correlated with better growth outcomes here in the UK or anywhere else for that matter)

I will deal with devolution first where, not surprisingly, the evidence is not at all supportive of Mr Healey’s claims, or those of his boss. This is a subject I first covered in a Noise Cancelling piece published in early July this year.

Aside from the fact that there is little voter interest in devolution, over the last twenty-five years of devolution history in the UK, since powers were delegated to Scotland, Wales and Northern Ireland in the late 90s, there has been no closing of the GDP per capita gap with England as can be seen in the chart below. In fact in Wales the gap has actually widened.
Relative GDP per head has barely moved since devolution
Once again, it appears politics triumphs over the facts. One might think that 25 years of devolution history which hasn’t delivered for people living in Scotland, Wales and Northern Ireland, despite disproportionate public spending, might temper the government’s bold claims about how more of the same will liberate growth in every region of the UK. My sense is that devolution leads to an even more bloated state rather than delivering growth so one can see why politicians like it but the evidence shows that it has had no positive effect on the economy.
For the record in 2024/25 public spending per head in England, Scotland, Northern Ireland and Wales was as follows:
- England: £13,134 per person.
- Scotland: £15,563 per person (19% higher).
- Wales: £15,155 per person (15% higher).
- Northern Ireland: £16,116 per person (23% higher).
Every devolved nation gets more spent on it per head than England
Investment is not the problem
So, finally, is more investment the answer to the economy’s ills as Mr Healey appears to believe. Before jumping to the conclusion, I wanted first to present the evidence.
Since the pandemic, investment spending and government spending have both been growing at about 2% pa, but household consumption has lagged significantly, only growing at about 0.3% a year. In fact, in real terms, household consumption is barely higher than it was in 2019 as can be seen in the chart below, whilst investment spending has grown by over 16% in real terms. Given that household spending is just over 60% of the economy, it’s no surprise therefore, that growth overall has only averaged 1% since the pandemic.
Households never got back to 2019
Indeed, investment spending is now close to a 66-year high as a proportion of GDP (20%) as is clear in the chart below, a level last reached at the end of the 1980s boom. Manufacturing was 17% of the economy as recently as 1990, against 8.5% now.
Investment has not been this big a share of the economy since 1989
The truth is that the UK economy has clearly not been suffering from a lack of investment in recent years. I am not suggesting more investment wouldn’t be a good thing, it might well be given the roll out of AI across the economy, but to suggest that the UK’s economic problems are a product of low investment is just not true and is clearly not supported by the facts.
Too much saving, not enough spending
The real problem lies elsewhere, in the consumer economy. As I have written on many occasions recently, what the UK is held back by is a lack of household spending which is also reflected, naturally, in a savings glut. Here are two charts, redrawn from the ONS data behind two new ones from the best economist in the UK, which show this very clearly.
Real incomes stopped growing
And the saving ratio went the other way
For clarity, the income bars record the average annual % growth in real household disposable income over the periods shown, and the saving ratio bars are simple period averages of the annual ratio. Real household spending tells the same story: 2.7% a year between 1960 and 2009, and 1.5% a year since 2010.
Here, in just two simple but brilliant charts, if I may be so bold, is the UK economy’s real problem presented in an historical context. Quite simply it’s too much saving and not enough spending which, as I have argued in a number of recent NC publications, is the direct product of two things:
- Excessively high interest rates.
- Excessive taxation.
Without rehearsing the arguments again here, suffice to say that the MPC has kept rates in the UK too high for too long whilst the government has added insult to injury by recklessly growing public spending and over taxing the economy. Both factors have resulted in excess saving whilst also constraining borrowing. The net result is very subdued consumption.
The right diagnosis
This is the right diagnosis and if Mr Healey was paying attention to the facts he would know it. Once armed with the correct diagnosis he might then start to think about what he might be able to do to deliver a cure, despite the fact that it’s the MPC that controls the most appropriate and effective medicine.
One place to start would be something his predecessor learned too late, which is to do all you can to limit the inflationary impact of government policy, but more fundamentally, should be a recognition that raising an already obscene tax burden on UK households will further harm the patient and in turn leave him miles away from his “defining mission” to deliver growth.
Of course, that also requires him and his boss to do the one thing that Labour governments seem utterly incapable of, despite their protestations of fiscal rectitude, and that’s to cut government spending.
So, to conclude, Mr Healey’s first major speech since taking on his new job was not just a missed opportunity but utterly pointless. It was full of the sort of vacuous, meaningless nonsense that his predecessor was also prone to emit but which, as before, will not be followed by appropriate actions.
The depressing reality is that Mr Healey appears to be both unaware of the real problems confronting the economy and incapable of doing what’s required to help deliver the solutions. I live in hope however, because I expect the economy to come good despite the unnecessary and inappropriate constraints policy makers place upon it.
Important information
The views expressed in this article are those of the author at the date of publication and not necessarily those of Curated Capital Ltd. The contents of this article are not intended as investment advice and will not be updated after publication unless otherwise stated.